Math · Geometry & data
Statistics, Distributions, and Simple Probability
Estimated time includes reading and one quiz. Take the time you need.
Start here: key ideas
- Mean uses every value; median uses the ordered middle position.
- Mode is the most frequent value and may be absent or repeated.
- Range measures total spread from minimum to maximum.
- Outliers usually pull the mean more than the median.
- Standard deviation describes spread around the mean; compare it qualitatively.
- For equally likely outcomes, probability is favorable outcomes divided by all outcomes.
What you’ll be able to do
- Calculate and interpret mean, median, mode, and range.
- Compare center and spread and explain how outliers affect summaries.
- Read distribution plots for balance, tail direction, one or two peaks, and spread; interpret standard deviation qualitatively.
- Find simple probability as favorable outcomes divided by total equally likely outcomes.
Mean uses every value; median uses the ordered middle position. Mode is the most frequent value and may be absent or repeated.
Optional review
If you’d like to review the basics, visit Tables, Charts, Graphs, and Relationships. You can start this lesson without completing those first.
Calculate center and range
The mean is sum÷count. The median is the ordered middle (or the mean of two middle values). The mode occurs most often and may be absent or multiple. The range is maximum−minimum.
Worked example: Sort 8,3,5,5,9 as 3,5,5,8,9. The sum is 30, so mean=6; median=5; mode=5; range=9−3=6.
Read values and how often they occur
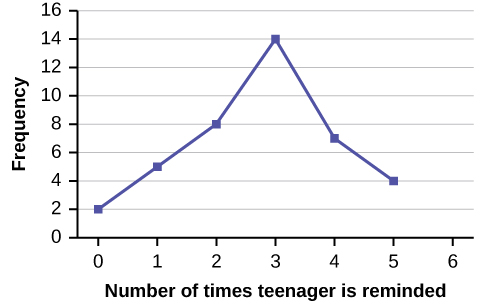
The horizontal axis gives the number of reminders; the vertical axis gives how often each value occurs. The mode is 3 reminders because it has the highest frequency, 14. A frequency of 14 is not itself a number of reminders. The connected points are a display of whole-number categories, not fractional reminders.
Read values and how often they occur — OpenStax / Introductory Statistics, via University of Hawaiʻi and Mathematics LibreTexts. CC BY 4.0. Source image reproduced unchanged.
Choose center and spread together
Mean uses every value and is pulled toward an outlier. Median uses position and is usually more resistant. Range measures total spread but also depends on extremes.
Worked example: For 2,4,6,8 the mean and median are 5. Add 30: the mean becomes 10 and the median becomes 6. The high outlier pulls the mean much farther. Always pair a center with a description of spread.
Choose a useful summary
Use the mean when values are reasonably balanced and every value should influence the center. Use the median when skew or an outlier would make the mean unrepresentative. Use the mode for the most common category or repeated value. Do not remove an outlier automatically; decide whether it is an error or a genuine observation.
Compare transformations and missing values
Adding the same constant to every value shifts mean and median by that constant but leaves range unchanged. Multiplying every value by a positive factor multiplies center and range by that factor. To find a missing value from a mean, multiply mean by count to recover the required total, then subtract the known values.
Read distribution shape and standard deviation
A distribution is unimodal with one peak and bimodal with two. A uniform distribution has roughly even frequencies. In a right-skewed distribution the long tail points toward larger values; in a left-skewed distribution it points toward smaller values. The tail names the skew.
Standard deviation describes typical distance from the mean. A low standard deviation means values cluster near the mean; a high standard deviation means they are more spread out. Compare it only when the units and context are meaningful. No advanced standard-deviation calculation is needed here.
Find simple probability
For equally likely outcomes, probability=favorable outcomes÷total outcomes. The answer is between 0 and 1 and can also be written as a fraction, decimal, or percent.
Worked example: A bag has 3 blue, 2 green, and 5 yellow tiles. There are 10 tiles total, so P(green)=2/10=1/5=0.20=20%. Count all possible outcomes in the denominator.
Terms to remember
- mean
- The sum of all values divided by the number of values.
- median
- The middle value of an ordered data set.
- mode
- The value or values occurring most often.
- range
- Maximum minus minimum.
- outlier
- A value unusually far from the rest of the data.
- distribution
- The overall pattern of values, including center, spread, and shape.
- spread
- How far data values vary from one another.
- standard deviation
- A measure of how spread out values are around their mean; no formula calculation is needed here.
- probability
- A number from 0 to 1 describing how likely an event is.
Your quick summary
- Mean uses every value; median uses the ordered middle position.
- Mode is the most frequent value and may be absent or repeated.
- Range measures total spread from minimum to maximum.
- Outliers pull the mean and enlarge the range, while the median is usually more resistant.
- Name skew by the long tail, and compare spread as well as center.
- Simple probability counts favorable outcomes out of the complete equally likely set.
Lesson quiz
Check what you learned, then review the explanations. This quiz saves results on this device only. Sign in to save quiz results to your account.