Science · Scientific investigation
Predicting Relationships and Outcomes
Estimated time includes reading and one quiz. Take the time you need.
Start here: key ideas
- In a direct relationship, two variables move in the same direction.
- In an inverse relationship, one rises as the other falls.
- Interpolation predicts within the measured range.
- Extrapolation predicts beyond the measured range and is less certain.
- Correlation alone does not prove causation.
What you’ll be able to do
- Identify direct, inverse, or no clear relationship.
- Make an interpolation from data.
- Explain why extrapolation is less certain.
- Tell correlation from causation.
Recognize common relationships, make careful predictions, and avoid confusing correlation with cause.
Optional review
If you’d like to review the basics, visit Data, Evidence, and Scientific Explanations. You can start this lesson without completing those first.
Direct, inverse, or absent
In everyday descriptions, a positive relationship means variables tend to increase together; a negative relationship means one tends to fall as the other rises. Some science questions call these direct and inverse trends. In mathematics, direct proportion is stricter: y/x is constant; inverse proportion requires xy constant. A trend alone does not establish either formula.
Read both axes, units and the measured interval. Describe the overall trend and important exceptions. A curve that rises and then levels off does not support unlimited straight-line extrapolation.
Make a bounded prediction from a graph
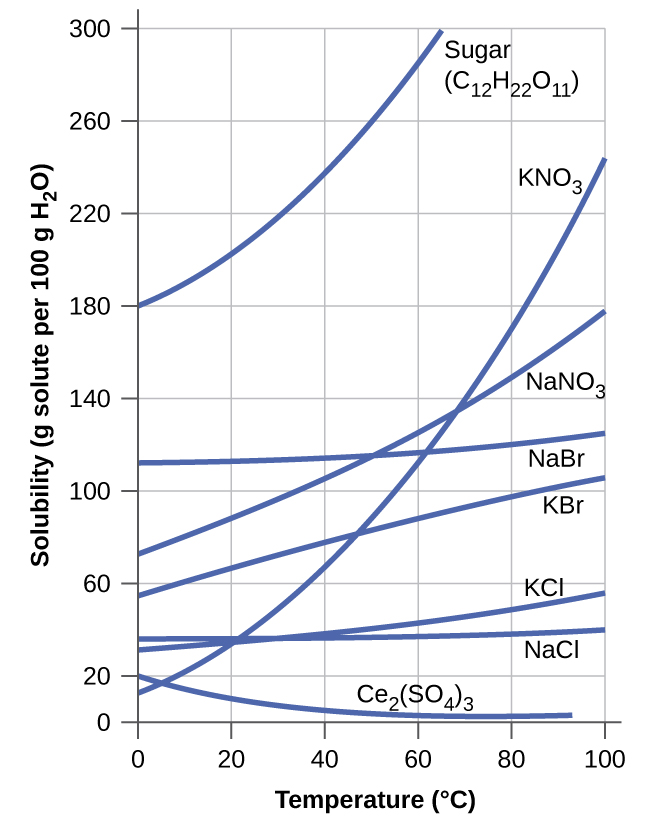
Follow one named substance’s curve and keep track of the units. A prediction between shown values is interpolation. A prediction beyond the shown range is extrapolation and needs more caution. Do not assume every substance follows the same curve.
Make a bounded prediction from a graph — OpenStax College, Chemistry (CC BY archive). CC BY 3.0. Original source image reproduced unchanged; explanatory caption added.

You've used your 1 free study guide
Your free topic allowance is shared across Reading, Math, Science and English. This first section is a preview. Unlock every study-guide
topic — full lessons, inline checks, the complete practice bank +
timed exam simulation — with a free trial.
Your one free topic stays free, always.
$0 today — card required to start your trial. Cancel anytime before day 3.
Already subscribed? Log in.